THE MAP IS THE METHODOLOGY
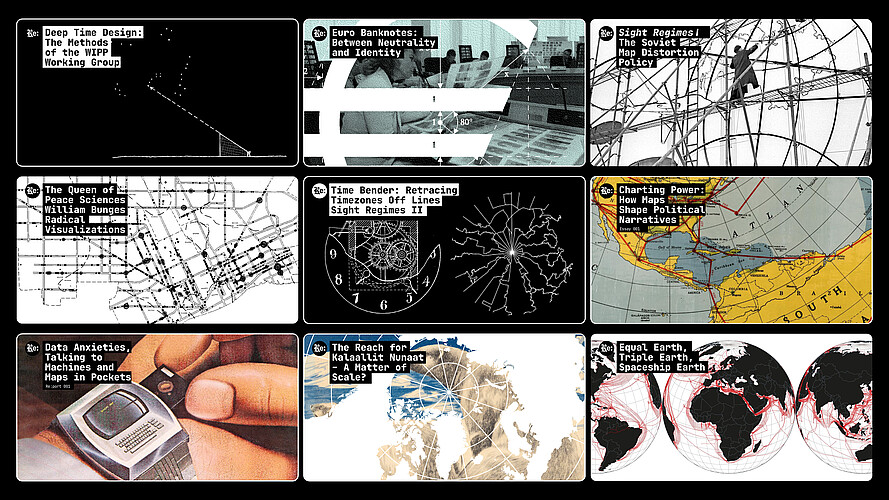
Research and publishing platform on data, design and visual representation, initiated as part of the advanced qualification project.
source: Re:connaissance Infoklasse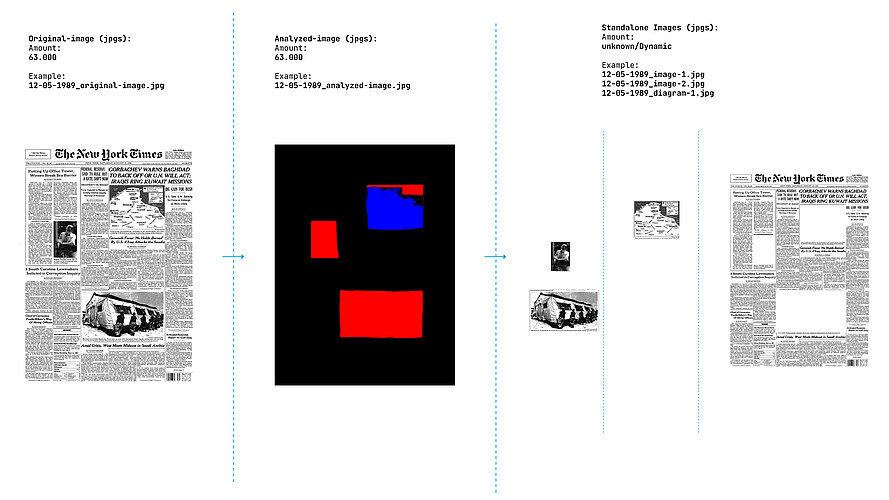
Study of 175 years of visual information design through around 62,500 front pages of The New York Times.
source: Re:connaissance Infoklasse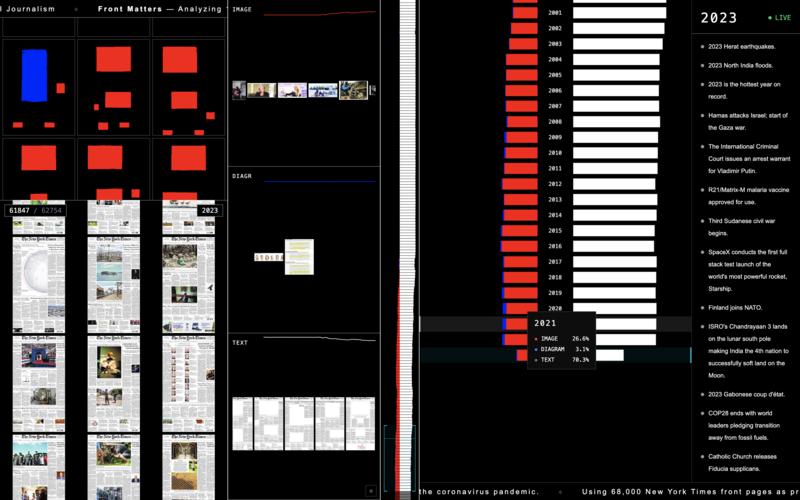
Interactive visualisation of text, image and diagram across 175 years — between overview, detail, scale and comparison.
source: Re:connaissance Infoklasse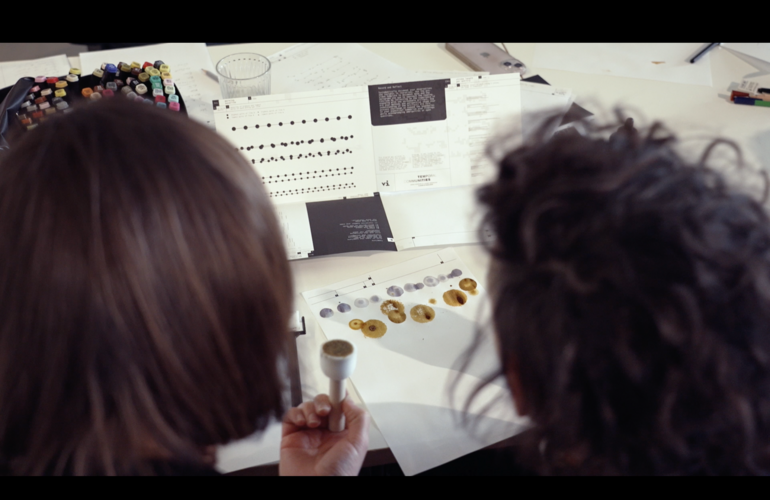
Workshop within the research project Reading Reading at Freie Universität Berlin on mapping, diagramming and visual annotation.
source: Re:connaissance Infoklasse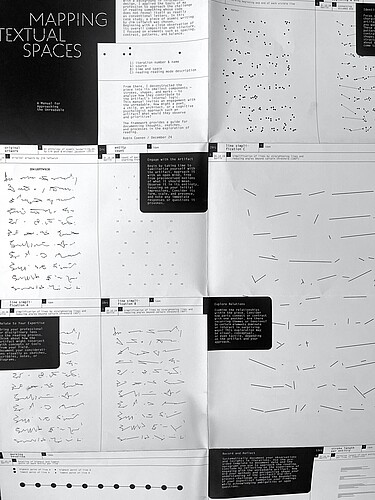
A Manual for Approaching the Unreadable — a visual investigation of asemic writing as spatial and relational structure.
source: Re:connaissance, Infoklasse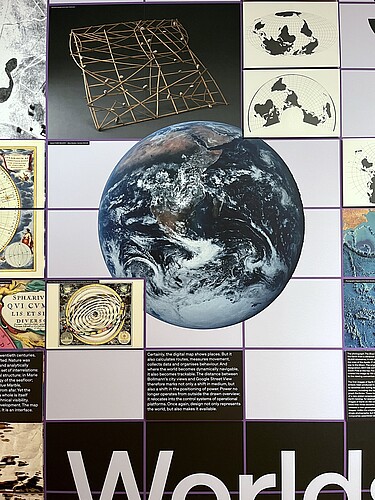
Research contribution to the Worlds section of the exhibition On Display at Museum Angewandte Kunst Frankfurt.
source: Re:connaissance InfoklasseErforschung kartografischer Visualisierungsstrategien als Werkzeuge für Wissen, Transformation und Dialog
»Darauf war niemand vorbereitet. Register, Protokolle und Berechnungen in Lichtgeschwindigkeit erreichen jeden denkbaren Punkt der Erde [...] die Tiefenschärfe der Datenproduktion, Granularität genannt, unterläuft das menschliche Wahrnehmungsvermögen. Lernfähige Algorithmen stoßen auf Zusammenhänge in Daten, Korrelationen in Fakten, von denen sich keine Theorie bislang eine Vorstellung machte.«
What Dirk Baecker describes so vividly in order to illustrate the so-called digital transformation also points to a central challenge for information designers in the 21st century: ever-growing amounts of heterogeneous, relational and increasingly machine-generated information encounter human capacities for perception and decision-making that cannot easily cope with this kind of granularity.
Information therefore has to be selected, organised, filtered and made visually accessible. Complexity here should not be simplified, but rather made accessible.
One design discipline that has long dealt with the visualisation of such granularity is cartography. Maps draw on almost the entire repertoire of graphic representation: text, symbols, lines, colour and areas are combined within a limited space.
At the same time, they organise information through cartographic processes such as scaling, projecting, abstracting, classifying, locating and relating.
These operation and processes structure not only representation, but also the knowledge that becomes visible through it. Maps therefore do not simply depict reality. Through selection, weighting, relation and perspective, they help determine which connections become visible, where boundaries emerge and from which position a subject is viewed.
At the centre of the research is the question of how cartographic visualisation strategies can be applied beyond geographical space: as methods for organising, investigating and making complex, relational and multimodal information visually accessible.
The research project is structured around three interconnected areas:
__Investigating cartographic visualisation strategies as a method for organising and visualising complex, non-geographical, relational and multimodal information
__Investigating cartographic visualisation strategies as a (participatory) tool for knowledge production
__Investigating cartographic visualisation strategies as an instrument for critical research and representation
The research project is developed through a recursive relationship between research, teaching and design practice. Insights, methods and questions are tested in different institutional and practical contexts, further developed and subsequently reflected upon comparatively.
Links:
Re:connaissance – On Data, Design and Visual Representation
reconnaissance.robincoenen.de
Infoklasse
infoklasse.de
Robin Coenen
robincoenen.de